La producción mundial total de patatas se estima en 388.191.000 toneladas en 2017 (Fuente: FAOSTAT, 2019)
El sector mundial de la patata está experimentando grandes cambios.
Hasta principios de la década de 1990, la mayoría de las patatas se cultivaban y consumían en Europa, Norteamérica y países de la antigua Unión Soviética.
Desde entonces, la producción y la demanda de la patata ha aumentado drásticamente en Asia, África y América Latina, donde la producción pasó de menos de 30 millones de toneladas a principios de la década de 1960 a más de 165 millones de toneladas en 2007.
Los datos de la FAO muestran que en 2005, por primera vez, la producción de papa del mundo en desarrollo superó a la del mundo desarrollado.
China es ahora el mayor productor de patata, y casi un tercio de todas las patatas se cosecha en China y la India.
(Click para agrandar) 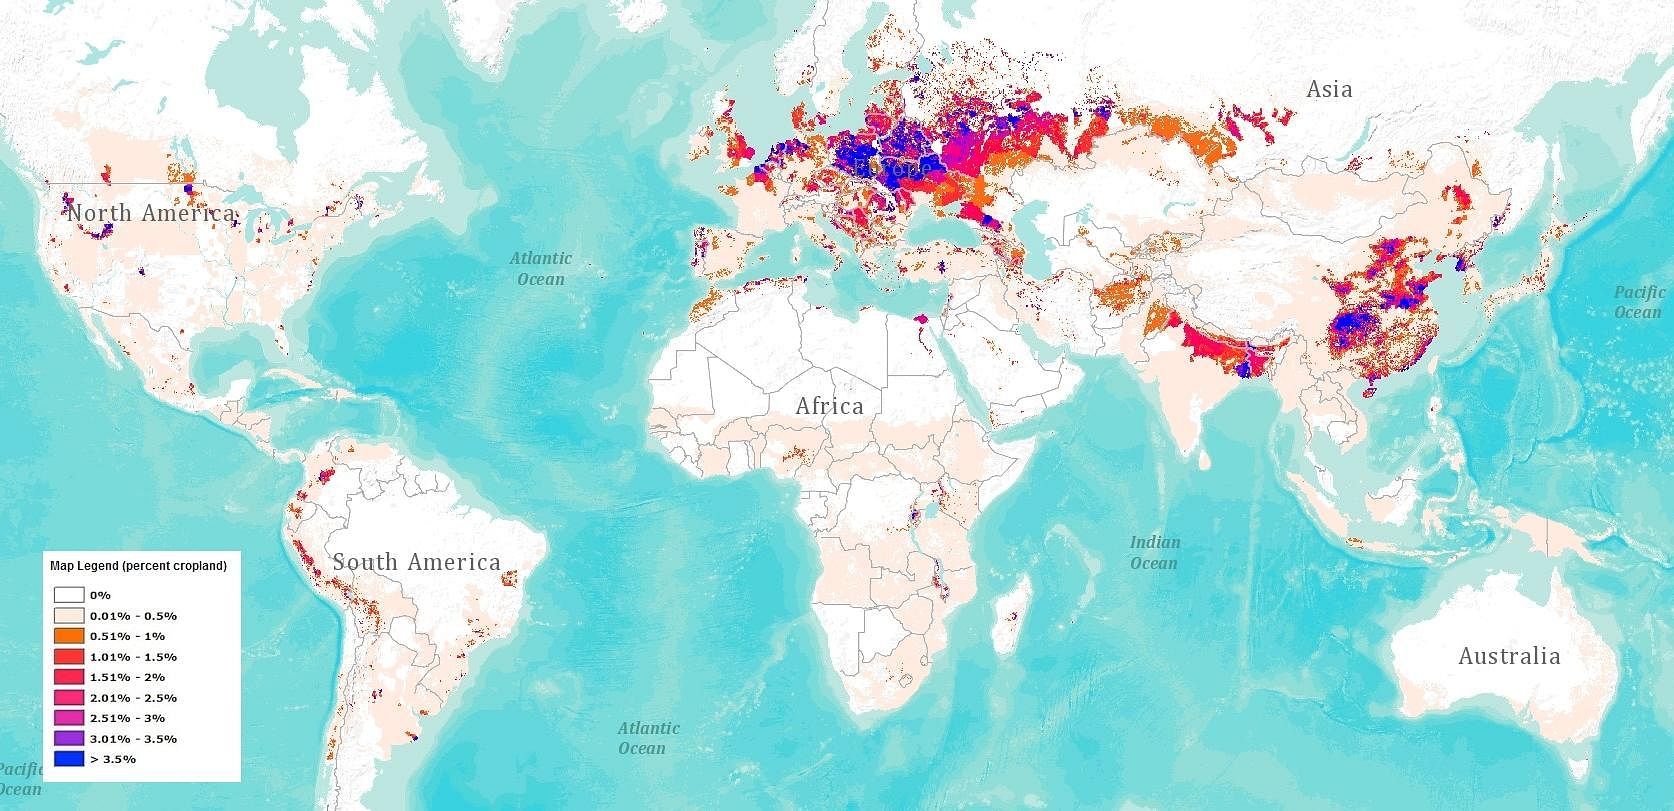
¿Dónde se cultivan las patatas? La distribución geográfica del cultivo de la patata en todo el mundo (Fuente: RTB Maps)